
Vacation rentals are similar to businesses: you balance income and expenses. By increasing one and decreasing the other, you pocket more money. And who doesn’t like that? But did you know there’s so much more you can do than raise nightly rates or slash monthly recurring expenses? To do this properly, you need the right vacation rental analytics.
Hostfully recently partnered up with Key Data Dashboard, a vacation rental software platform that analyzes your property’s performance indicators and presents metrics on a convenient dashboard. Key Data Dashboard showed us a few analytical insights that may even seem counter-intuitive! For example, sometimes, renting your property less often but at a higher nightly rate can actually net you more money.
In this article, we’ll take advantage of Key Data Dashboard’s expertise and look at a few vacation rental analytical ratios any host can calculate in a few minutes. These ratios can be used to identify potential lost revenue or make better-informed decisions. Let’s dive in!
The “Big 3” vacation rental analytics ratios
Analytics in the vacation rental industry starts with three important variables. These “Big 3” are used to diagnose the status of your vacation rental’s ability to generate income.
Occupancy rate
The Occupancy Rate (OR) is the simplest vacation rental analytical ratio to calculate. Just divide the number of nights the property is booked by the number of days in your period. Most of the time, a monthly period of 30-31 days is used.

Pretty straightforward, right?
Unfortunately, the Occupancy Rate is flawed. It doesn’t take into account nights your vacation rental isn’t available or not generating income. Why wouldn’t a property generate income? There’s a lot of reasons:
- The owner’s family or friends are staying there.
- The property is on hold for cleaning. This is common for properties where cleaners or the host have to travel long distances to clean.
- The property isn’t available due to maintenance or repairs.
- You’ve reached a maximum number of rentable nights for a month (if limited by a city bylaw.)
All the reasons listed above can skew the Occupancy Rate to make it seem as though the property is occupied more than it really is. To fix this, we have to remove the nights the property isn’t generating income from the calculation. Here’s a more accurate representation of the Occupancy Rate for hosts and vacation rental property managers. It’s called the Available Occupancy Rate (AOR):

Let’s look at an example. A cottage books on Airbnb, Vrbo or HomeAway for 18 days out of the month. The owner stays there for 4 weekend days out of the month, and another 2 days are eaten up by cleaning crews not being available to turn over the property in under 24 hours:
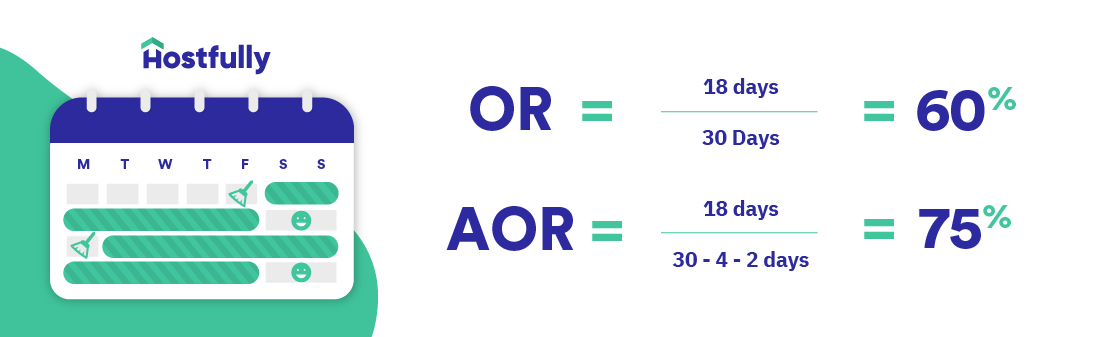
By calculating the AOR (75%) instead of the OR (60%), we can see that the property isn’t maximized for income generation (from an occupancy perspective.)
Recommendation
When calculating your monthly vacation rental analytics, crunch numbers for both the OR and AOR. Any discrepancy over 10% that isn’t related to the owner (or yourself) using the property for personal use represents lost income potential. You can look into solutions like hiring local cleaning crews, or paying a premium for an overnight turnover instead of the team showing up during the day. As for maintenance, look into clustering different types of work on the same days.
Average Daily Rate
The Average Daily Rate (ADR) is the average revenue paid by guests during a specific period. Like the Occupancy Rate, it’s also often calculated per month.

What’s great with looking at the ADR is that it takes into account dynamic pricing. If your nightly rate changes based on weekends and seasonal highs and lows, it’s hard to predict how much revenue can be generated.
Side note on dynamic pricing
Dynamic pricing is a great way to boost revenue by taking advantage of seasonal highs and lows, events that draw in tourists and adjusting to the competition around you. You charge more when there’s demand and low when you just want guests to rent the property. In other words, it’s a revenue-boosting tactic every host should be using.
Adjusting rates is also one of the variables Airbnb uses to determine if your property should be shown first in the search results.
For hosts that want a hands-off approach to dynamic pricing (it can be tedious to do by hand), services like Wheelhouse integrate seamlessly into the Hostfully Property Management Software. Just set it and forget it!

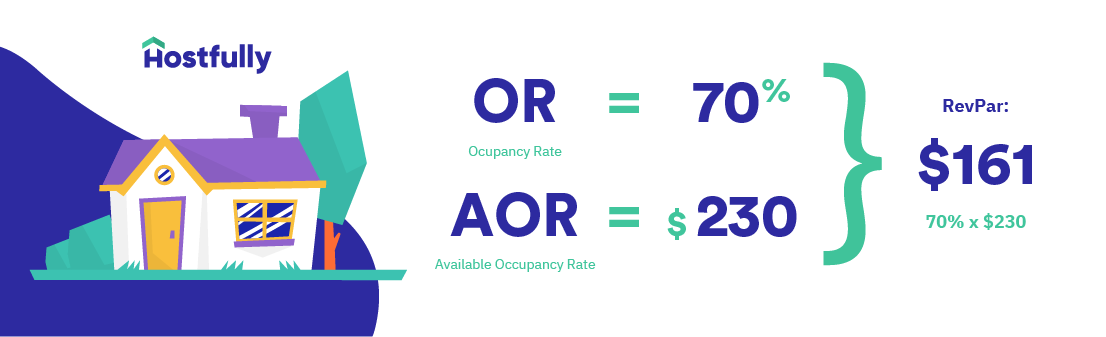
Revenue per available night (RevPar)
So far, there hasn’t been a variable hosts can use to maximize revenue. This is where RevPar comes in. Not only does this metric sound cool, but it also takes into consideration occupancy and revenue together:

As we’ll explore below, there’s a lot we can glean from RevPar.
Occupancy Rate, Average Daily Rate, and RevPar: which is best?
The OR and ADR are standalone metrics that evaluate one specific aspect of the vacation rental. But with RevPar, you incorporate income generation potential with occupancy rates. It’s also a metric that can help you predict your yearly earning potential once you have enough data.
It’s not just about Occupancy Rates
Optimizing your operations, marketing, and pricing strategies to get close to 100% occupancy is a puzzle faced by many hosts. Unfortunately, high occupancy isn’t always a useful vacation rental metric. The more your vacation rental property gets booked and used by guests, the more it wears and tears. Keep in mind that the OR/AOR is directly linked to higher maintenance expenses. Not to mention that reaching a 100% OR/AOR can mean you’re leaving money on the table – your property may be priced too cheaply.
…And not just the Average Daily Rate either
You might think a high ADR is ideal, but just like the OR/AOR, it’s a double-edged sword. A high ADR usually entails a lower occupancy rate. And if your property isn’t booked often enough, that also means less revenue.
This is where the RevPar can come in handy. It takes into account both variables. Let’s look at an example:
An example and some math
A vacation rental has the following current analytics:

That means the property can generate a revenue of $54,750 ($150 x 365 days) for the year. What if we were to raise the nightly rate a bit? That would lower the AOR but also increase the ADR. We’d have this situation:
That same property would now generate $58,765 instead of the previous $54,750. And that’s with fewer expenses related to maintenance, cleaning costs, and guest welcome items. Not bad, right? By looking at the RevPar instead of the nightly rate alone, we were able to boost earnings by $4,000 a year. On top of that, the host or property manager will stand to save a potential of 5% in maintenance and cleaning costs. That’s a win-win!
Integrating analytics into your vacation rental operations
So far, all of this is still theoretical. But how can analytics for vacation rental owners be practically implemented? After all, keeping track of all these numbers in a spreadsheet seems like a tedious task. This is where a service like Key Data Dashboard comes in. The software tracks everything for you in real-time. It also seamlessly integrates with Hostfully’s PMS, meaning that you get all their useful insights on one platform.

The takeaway
Keeping track of vacation rental analytics is vital for hosts that want to scale their business quickly. With pertinent information at your fingertips, you can boost revenue and lower expenses simultaneously.