Every tool you need in one powerful property management software
Earn more, save time, and elevate the guest experience with the most popular features used by the industry’s most successful vacation rental management companies.
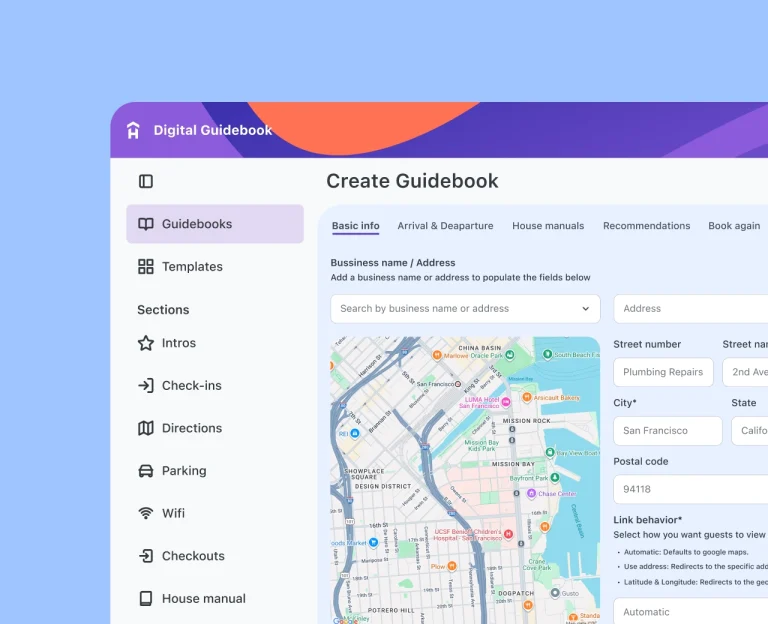
Give your guests everything they need, and bring in extra income with our beautiful digital guidebooks, loaded with all the info your guests could imagine.
Your first guidebook is always free, forever. No credit card required.
When guests stay longer, details matter more. Hostfully gives you the tools to deliver consistent operations ensuring every guest, from traveling nurses to remote workers, feels right at home
When every detail matters, nothing can fall through the cracks. Hostfully helps your team deliver seamless stays and manage high-value properties with precision and grace.
Hostfully is the best property management software for independent hosts. Sync calendars, automate guest communication, and grow direct bookings with ease.
Managing dozens of properties means constant motion with guests, owners, teams, and vendors all at once. Hostfully brings it all under one system, automates your routines, prevents mistakes, and helps your business grow without burning out.
Disjointed systems limit scale. Unified ones unlock it. Hostfully gives your team the control, automation, and visibility needed to operate with precision, while keeping every guest experience seamless.
“I like the visual format of the guidebook and how the information is presented to the end user. We are a small vacation rental business with only one property. However, for a low cost, we have a professional guidebook that can be shared easily with our guests. I love how customizable it is, and I can decide how little or how much information I want to include. The marketplace feature has been very valuable.”
Stephanie
capterra
Helpful resources
Learn about our customers’ success stories, read up about the latest industry insights and trends, explore our help articles and blogs, and watch or join a live or on-demand webinar. All free, all for you.
Select Stays automated owner reporting with Hostfully, generating 45 detailed reports in 10 minutes, cutting prep time by 90%, and scaling 3x with full transparency.
Off-season demand exists—you just need the right strategy. Learn how to optimize pricing, marketing, and guest experience to turn slow months into profitable ones.