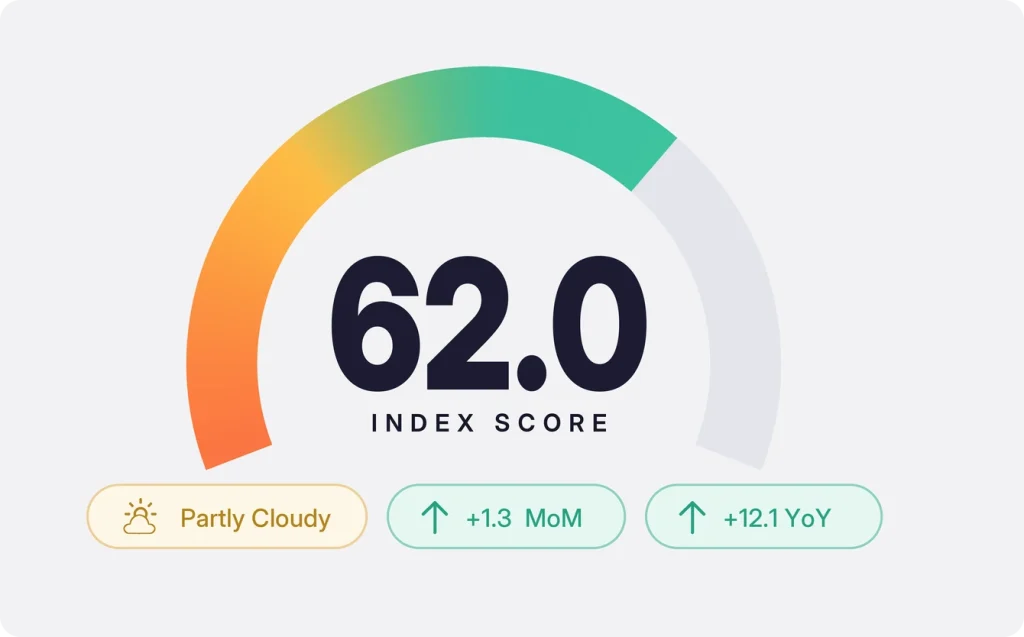
Summary: The national forecast has brightened, but the clouds have not cleared. November’s Getaway Score rises to 62.0, up 1.3 points from October and still rated Partly Cloudy. Stronger air-travel readings provide a tailwind, while a small decline in fuel costs offers some relief and consumer sentiment barely moves. Beneath that national improvement, the local picture tells a more selective story: Cleveland leads the rental-revenue panel, Phoenix gains ground, and a high rank does not always mean improving conditions.
Every month, the Hostfully Hosting & Travel Index brings travel and economic signals into a single 0-to-100 Getaway Score. Think of it as the weather report for your vacation rental business: a way to see the broader conditions before deciding what to do with your own calendar.
This month’s score returns to September’s published 62.0 after October’s dip to 60.7. The headline has improved; the more useful question is where that improvement shows up, and where it does not.
The Big Story: More Movement, Not an All-Clear
October gave the national reading a lift at the airport. TSA screenings averaged 2.54 million a day from October 1–29, compared with 2.35 million in September, an increase of about 7.7% in the daily average calculated from TSA’s passenger-volume data.
That is a meaningful travel signal. It is also the start of the conversation, not the end: an airport checkpoint does not tell you whether a traveler booked a vacation rental, which destination they chose or how much they spent.
The guest’s budget delivered a smaller change. The October regular-gasoline observation slipped to $4.31 a gallon from $4.355 in September in the EIA series distributed through FRED, while the University of Michigan’s final sentiment reading edged from 48.1 to 48.0 in the consumer survey.
Put those signals together, and the November mood is more measured than celebratory. Travel activity has strengthened, the fuel bill is a little less demanding, and confidence has not supplied a comparable lift.
For operators, that argues for attention rather than autopilot. A better national reading is a good reason to review pricing and availability, not a reason to raise every rate or assume the next reservation will arrive on its own.
The Signal View: One Clear Tailwind, Limited Relief Elsewhere
Three observed readings help explain the tension inside the national picture. The dates matter here: the airport comparison uses daily averages, including the October observations available at the edition cutoff, rather than a full-month passenger total.
| Signal | Previous reading | Latest reading | What changed |
|---|---|---|---|
| TSA throughput | 2.35 million daily screenings, September | 2.54 million, October 1–29 | Daily average up approximately 7.7%, calculated from TSA. |
| Regular gasoline | $4.355/gallon, September | $4.310/gallon, October | Down 4.5 cents, or about 1.0%, in the EIA/FRED series. |
| Consumer sentiment | 48.1, September final | 48.0, October final | Almost unchanged, according to the University of Michigan. |
The strongest movement in this snapshot is travel activity, not a dramatic improvement in the household mood. That distinction should carry through to your messaging: make the stay easy to understand and worth choosing, rather than assuming a slightly better national score has removed every objection.
Gas: A Little Breathing Room, Not a Budget Reset
A 4.5-cent decline is welcome, but it is a modest change in the overall cost of a trip. The latest gasoline reading remains above $4 a gallon in the EIA/FRED series, so fuel still deserves a place in the drive-market conversation.
The useful response is not to turn every listing into a gas-price comparison. It is to make the value of the stay concrete.
If the property includes parking, say so clearly. If guests can walk to the places they came to visit, explain the route; if the kitchen is genuinely equipped for family meals, show what is there rather than stopping at “fully stocked.”
These details give a guest something specific to evaluate. They also let you explain value without cutting the nightly rate first and working out the margin later.
Sentiment: The Mood Did Not Get the Memo
The final October sentiment reading of 48.0 is barely different from September’s 48.1 in the University of Michigan survey. It does not support a story about a sudden burst of consumer optimism.
That does not mean nobody will book. It means confidence alone offers little reason to expect an easier sale, so clarity remains part of the job.
Look at the questions a guest needs answered before choosing the stay: the total price, the sleeping arrangements, the cancellation terms, and what happens at check-in. Make those answers easy to find, especially when a property’s value depends on details that are not obvious in the first photo.
The aim is not to talk a cautious guest out of caution. It is to remove avoidable uncertainty from a decision they are already considering.

The Regional Forecast: The Midwest Leads, With Clouds Still in View
The local panel adds a rental-specific lens to the national picture. Its latest common reporting window is July–September 2026, compared with the same months in 2025; displayed point changes compare that reading with June–August under the same model.
Each regional score averages four markets in the fixed 20-market panel. The inputs are public estimates of typical rental revenue, not audited results for every property or state.
| Region | Local score | Change from the previous rolling window | Conditions |
|---|---|---|---|
| Midwest | 46.2 | −9.0 | Cloudy |
| Mountain | 33.0 | −8.4 | Stormy |
| Southeast | 31.6 | −9.8 | Stormy |
| West | 24.5 | −8.6 | Stormy |
| Northeast | 4.6 | −3.1 | Stormy |
The Midwest leads this sample, but leadership is relative: its average still sits below the local scale’s midpoint of 50. That midpoint represents flat year-over-year typical rental revenue at the city level, not 50% occupancy.
The useful lesson is that a strong destination cannot speak for an entire region. Cleveland’s position at the top of the city panel does not erase the different readings from Tulsa, Minneapolis, and Detroit.
City Movers: Cleveland Leads. Phoenix Improves.
Cleveland and Phoenix show why rank and direction belong in the same conversation. One tells you where a market stands on the panel; the other tells you whether its reading has improved relative to the previous rolling window.
| Market | Local score | Point change | Typical rental revenue, year over year |
|---|---|---|---|
| Cleveland, OH | 68.6 | −6.0 | +8.1% |
| Phoenix, AZ | 52.7 | +3.9 | +1.1% |
| Miami, FL | 49.0 | −8.6 | −0.4% |
Cleveland’s 68.6 leads the 20-market panel, but its score is 6.0 points lower than the preceding June–August reading. Typical rental revenue is still above the corresponding year-earlier window; the growth signal has slowed, not disappeared.
Phoenix tells the reverse story. Its score is lower than Cleveland’s, but the 3.9-point improvement makes it the clearest positive mover in this edition’s local panel.
Miami’s 49.0 sits close to the flat-revenue midpoint. Its 0.4% year-over-year revenue decline is much smaller than the 8.6-point change in the score might suggest if you mistake points for percentage growth.
At the other end of the panel, Bar Harbor’s typical rental revenue is 35.9% below the year-earlier window, calculated from Chalet’s monthly report. That is a reason to examine comparable property performance carefully, not to treat the local score of 1.2 as an occupancy rate or a forecast for every listing.
This is the distinction to keep in view: a leaderboard is not a pricing instruction. Your own achieved rates, booked nights, and comparable-date pace still decide whether the next move should be a rate change, a stay-rule adjustment, or no change at all.
What This Means for Property Managers
November offers a slightly brighter national forecast and a local panel that rewards a closer look. Your job is to turn those signals into specific calendar decisions, not one blanket response across the portfolio.
Compare the same dates at the same lead time
Before declaring that a month is ahead or behind, compare the same stay dates at the same point in the booking window. Account for weekday patterns, holidays, and changes in the properties available to book.
A booking total without that context can send you toward a discount you do not need. Start with the comparison, then choose the response.
Separate rate, nights and revenue
Review achieved nightly rates alongside booked nights and revenue. A stronger rate does not necessarily mean stronger total performance, and a fuller calendar does not automatically mean a better margin.
The local Index is useful context for that review. Your property reports can show which part of the equation needs attention.
Work on the gaps, not the whole month
Check whether an open date is genuinely weak or simply affected by a minimum-stay rule, a blocked arrival day, or a gap between longer reservations. Fix the restriction before assuming price is the problem.
Where a change makes sense, make it deliberately. Protect dates already booking at healthy rates rather than dragging them into a month-wide promotion.
Sell the stay’s value in specifics
Replace broad promises with details guests can use: parking arrangements, sleeping configurations, kitchen equipment, and distances to relevant places. Keep the total price and important terms easy to understand.
That is especially useful when a property is not the cheapest option. Give the guest a clear basis for choosing it beyond a nightly rate comparison.
Give owners context, not just a color
Explain the difference between the national reading, the local market signal, and the property’s own results. A regional Stormy label does not mean every home is underperforming, just as Cleveland’s leading score does not mean every calendar is full.
Use the Index to open the discussion, then show the owner the property-level evidence behind your recommendation. That makes the next action easier to understand and defend.
Looking Ahead: What Would Make December Brighter?
The next edition will test whether November’s national lift has staying power. Watch for evidence, not just a more encouraging headline.
- Travel activity: Does the next available airport reading support the improvement, and how does its timing compare with holiday travel?
- The guest’s budget: Do fuel costs continue to ease, and does consumer sentiment move meaningfully rather than by a tenth of a point?
- The next local reporting window: Do new matched rental-revenue observations support the same leaders and movers? Keep the period consistent before calling a change.
- Your own booking pace: Are the dates you targeted filling at rates and stay lengths that make sense for the property?
None of those requires guessing a December score today. They give you a useful watchlist for deciding what to revisit when the next observations arrive.
Navigate the Mixed Forecast With Hostfully
The Index tells you where to look. Your booking reports tell you what needs attention inside the business.
Keep that second step close to the first: review the calendar, understand the gaps and give guests and owners clear information. If you are reviewing how your team manages that work, request a Hostfully demo.
Explore the Full Index
The November dashboard brings together the 62.0 national score, regional samples, city rankings, and market movements. Explore the Hosting & Travel Index to see the full picture before deciding what to change.
The national and local readings use different reporting windows, labeled in the dashboard. Local point changes compare consistent rolling windows under the current model, not the new scale against previously published city scores.
About the Hosting & Travel Index
The Hostfully Hosting & Travel Index is a monthly composite score tracking the health of the U.S. vacation rental market. It aggregates seven weighted signals: TSA throughput (20%), Google Trends (20%), Hostfully platform data (15%), gas prices (15%), lodging CPI (10%), consumer sentiment (10%), and weather (10%). Data sources include TSA.gov, the U.S. Bureau of Labor Statistics, the University of Michigan, AAA, NOAA, Google Trends, AirROI, the U.S. Travel Association, and Hostfully’s proprietary booking data. The index covers 50+ U.S. metro areas with monthly city-level and regional scoring.
Sources: TSA.gov, AAA, University of Michigan Consumer Sentiment Survey, BLS CPI Data, Google Trends, NOAA National Hurricane Center, AirROI Market Data, U.S. Travel Association, Hostfully Platform Data.