
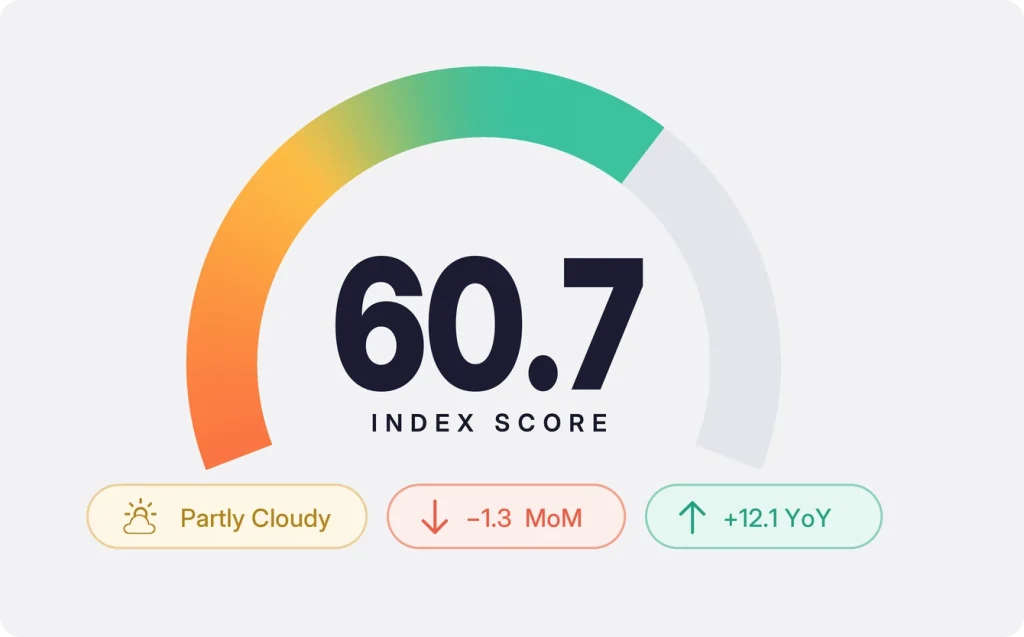
The October Getaway Score is 60.7, down 1.3 points from September’s 62.0, under the index’s continuity calculation, which uses Hostfully and a variety of publicly available data. Air traffic has cooled after summer, fuel costs have climbed, and consumer sentiment has softened, while lodging prices provide a partial offset.
For vacation rental operators, the message is not “discount everything.” It is “make the value clear, then price the dates that actually need help.”
A modest step down
October follows a published score of 63.5 in July, 64.5 in August, and 62.0 in September. The new reading keeps that history intact rather than replacing earlier editions with a different scale.
The index tracks broad conditions, not the performance of every destination or property. A lower national reading is not a substitute for your own booking data; it’s a reason to look more closely at your calendar.
The trip costs more
The September observation in the EIA/FRED regular gasoline series rose to $4.355 per gallon from $4.058 in August. For managers serving drive markets, this adds another cost to the guest’s trip budget before they reach the property.

Our recommendation: make total pricing easy to understand and explain the value you genuinely provide. Included parking, a useful kitchen or a walkable location can help a guest evaluate the whole stay, without promising savings you have not measured.
Summer traffic cools, and confidence follows
September TSA screenings averaged 2.35 million per day, down 5.0% from August, calculated from TSA’s daily table. That series retains seasonal patterns, so the post-summer step down should not be read as proof that vacation rental demand has collapsed.
Michigan’s final September sentiment index fell to 48.1 from 51.7 in August. A more cautious consumer deserves clearer answers about price, flexibility, and what is included; sentiment alone does not tell you whether a particular guest will book.
The latest available lodging CPI observation rose from 185.934 in July to 190.316 in August. The index retains its positive pricing-power interpretation, though rising lodging costs do not automatically benefit every operator.
Fall is not one market
AirDNA’s foliage report puts fall nights booked 9.8% ahead across 19 East and Midwest markets for late September through late November. That is a geographically specific sample, not a national booking-growth rate.
The distinction matters. The national mood can soften even as a particular weekend, destination, or property still has strong demand; broad discounting can erode value on dates that never needed it.
What to do with the October reading
- Compare matched dates: check the same weekdays, holiday windows, and booking lead times before drawing conclusions from a monthly total.
- Show the full price: make fees, included amenities, and stay requirements easy to understand.
- Separate strong dates from weak ones: use your property’s pace to decide where a rate or minimum-stay adjustment makes sense.
- Keep the guest’s whole trip in view: explain the benefits your property actually offers, rather than relying on a lower nightly price to do all the work.
Explore the full index
The Hosting & Travel Index updates monthly with fresh data across all seven components and 50-plus U.S. cities. Dig into regional breakdowns, track your market over time, and see what changed this month and why. The index describes broad travel conditions, not occupancy, revenue, or a booking forecast. You’ll also find the source links, component weights, and full methodology.
View the Hosting & Travel Index
About the Hosting & Travel Index
The Hostfully Hosting & Travel Index is a monthly composite score tracking the health of the U.S. vacation rental market. It aggregates seven weighted signals: TSA throughput (20%), Google Trends (20%), Hostfully platform data (15%), gas prices (15%), lodging CPI (10%), consumer sentiment (10%), and weather (10%). Data sources include TSA.gov, the U.S. Bureau of Labor Statistics, the University of Michigan, AAA, NOAA, Google Trends, AirROI, the U.S. Travel Association, and Hostfully’s proprietary booking data. The index covers 50+ U.S. metro areas with monthly city-level and regional scoring.
Sources: TSA.gov, AAA, University of Michigan Consumer Sentiment Survey, BLS CPI Data, Google Trends, NOAA National Hurricane Center, AirROI Market Data, U.S. Travel Association, Hostfully Platform Data.