
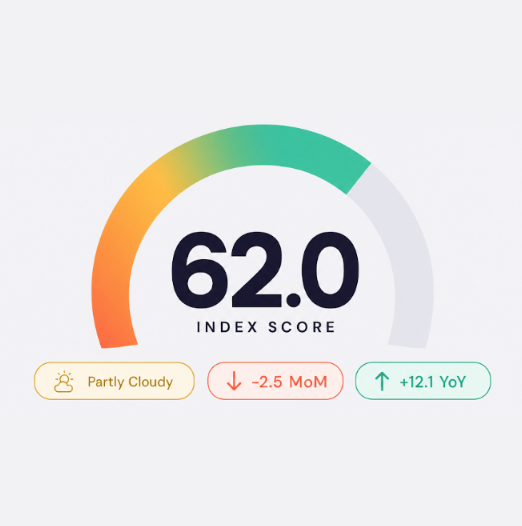
Every month, the Hostfully Hosting & Travel Index aggregates seven signals across the U.S. vacation rental landscape: TSA throughput, Google search trends, gas prices, lodging CPI, consumer sentiment, weather, and Hostfully platform data. Together, they produce a single 0-to-100 Getaway Score that tells property managers whether the wind is at their backs or in their faces.
This month’s score: 62.0 out of 100, rated Partly Cloudy. That is 2.5 points below August and 12.1 points above September 2025. The story is a widening gap between what Americans say about the economy and what they do with their vacation dollars. Sentiment and gas ran hard against us. Behavior, weather, and industry pacing ran hard for us. Net: a slight step back on a much better year-over-year foundation.
The big story: Vibes down, bookings up
August handed the index a genuine paradox. The University of Michigan’s final August Consumer Sentiment reading landed at 51.7, a 6.3% one-month decline and 11.2% below a year ago. The Conference Board’s consumer confidence fell to 89.4, its lowest reading in seven months. On paper, that is a demand warning. It should have shown up in the booking data. It did not.
AirDNA’s July U.S. market review reported that short-term rental RevPAR climbed 7.2% year over year to $217.17, with average daily rates rising in 49 of the 50 largest U.S. markets. HomeToGo’s 2026 Labor Day report showed U.S. search interest up 23% year over year, with 90% of searches going to rural destinations and domestic trips accounting for 65% of demand (+13.5% YoY). And AAA’s Labor Day pricing snapshot put domestic airfare at $750 (+2% YoY), popular-destination airfare at $790 (+20%), and domestic hotels at +9% versus 2025.
Then the third leg of the disconnect: gas set the wrong record. AAA reported that August 2026 is on track to be the most expensive August at the pump ever, with the national average at $4.09 on August 27, up from $3.21 a year earlier. For the first time in history, every single day in August averaged above $4. And travelers went anyway.
The final counterweight is the sky. The Atlantic is running below normal so far. Through August 30, the National Hurricane Center counts four short-lived named storms, zero hurricanes, and an ACE index of 3.6. NOAA’s August update now puts the odds of a below-normal season at 75%, up from 55% in June. Peak Atlantic activity still runs through October, so this is a supply-side gift, not a season-over signal.
“August was a mood-versus-money month. The confidence surveys said pull back. The credit card said go anyway. Our operators saw shorter booking windows but stronger conversion, higher intent, and a Labor Day pace that would have made 2019 blush. The lesson is not to dismiss sentiment. It is to trust the booking curve when the two disagree, and to make it easy for a hesitant guest to say yes.” Margot Schmorak, CEO, Hostfully
Two big wins, two bigger losses: The component view
Here is the component-by-component view of why the score moved from 64.5 to 62.0:
| Signal | September | August | Change | Why |
| TSA Throughput | 80 | 82 | -2 | Strong pace, tick down from July peak |
| Search Trends | 72 | 74 | -2 | Fall shift; foliage searches climbing |
| Gas Prices | 40 | 48 | -8 | $4.09 record August, +28% YoY |
| Lodging CPI | 66 | 62 | +4 | July CPI 3.4% YoY, core 2.5% |
| Sentiment | 42 | 58 | -16 | UMich 51.7, Conf Board 7-month low |
| Weather | 78 | 62 | +16 | 0 hurricanes through Aug 30; NOAA 75% below-normal odds |
| Hostfully Data | 70 | 65 | +5 | AirDNA RevPAR +7.2% YoY in July; rates up in 49 of 50 markets |
The signals split cleanly. Down: sentiment (-16) and gas (-8), the two things guests feel. Up: weather (+16) and industry data (+5), the two things that determine whether the trip actually happens. CPI added a friendly +4. TSA and search trends drifted lower on normal post-summer seasonality. The net move is small, but the tension inside the number is the whole story.
Sentiment: The Vibecession returns
The University of Michigan’s final August reading came in at 51.7, down from a July final of 55.2. That is a 6.3% one-month decline and 11.2% below August 2025. The Conference Board’s consumer confidence dropped to 89.4, its lowest since January, with the Expectations Index falling 5.8 points to 68.2. That gap relative to the Present Situation reading has historically flagged weaker forward demand.
The drivers are familiar: inflation worries linked to renewed Middle East tension, a softer labor-market outlook, and gas at $4.09 in every single window. This is a real reading. But it is also a reading that has now been disagreeing with the actual travel data for 12 months. If you had traded off sentiment alone in 2026, you would have missed a summer where AirDNA reported rates rising in 49 of the 50 largest U.S. markets.
Gas: The first August ever above $4 every day
AAA’s late-August update was blunt. The national average is $4.09 heading into the holiday, versus $3.21 a year ago, and August 2026 is on track to be the most expensive August at the pump on record, surpassing the previous August record of $3.97 set in 2022. For the first time on record, every single day in the month averaged above $4. California and Hawaii are averaging near $5.50 a gallon.
And yet the guest went. AAA reports Labor Day airfare at $750 (+2% YoY) and popular-destination airfare at $790 (+20%), with heavier road traffic expected across the holiday window. This is the strongest evidence yet that drive-market elasticity has changed since 2022. Guests have priced $4 gas into their mental math. What they will not accept is a listing that pretends gas is not a factor. The operators who won August were the ones who told the total-trip-cost story honestly and made non-cost value obvious.
Behavior: The booking curve held (actually, it extended)
AirDNA’s July U.S. market review contains the number of the month. U.S. short-term rental RevPAR climbed 7.2% year over year in July to $217.17, with average daily rates rising in 49 of the 50 largest U.S. markets. That is a rare kind of breadth in a supply-heavy year: pricing power that is showing up almost everywhere at once.
HomeToGo’s Labor Day search data adds to the composition. 90% of searches went to rural and small-town destinations, overall searches were up 23% year over year, and domestic share held at 65% (+13.5% YoY). The Northeast, the Rockies, and Appalachia dominated the top-searched list. This is the fall shift showing up early. Guests are trading the beach for foliage two weeks ahead of the traditional pivot.
The pricing side confirms it. AAA’s Labor Day report puts average domestic airfare at $750 (up 2% YoY), with popular-destination fares averaging $790 (+20%). Domestic hotels are up 9%; international hotels are up 12%. Cruise demand is running strong to Seattle, Anchorage, and Vancouver, and AAA expects the heaviest road congestion on Thursday and Friday of the holiday. Notice the geographic spread. This is not a coastal-only holiday.
Weather: A supply-side gift from the Atlantic
The Atlantic is running below normal. Through August 30, only four short-lived named storms have formed (Arthur, Bertha, Cristobal, and the remnants of Dolly), none have reached hurricane strength, and the Accumulated Cyclone Energy index sits at 3.6. NOAA’s August update raised the odds of a below-normal season to 75%, and Colorado State University’s final outlook is now nine total named storms and just one major hurricane for the season. Peak activity still runs through October, and forecasters are watching Gulf and Caribbean disturbances, but the September index reflects the reality on the ground: an unusually calm Atlantic through Labor Day.
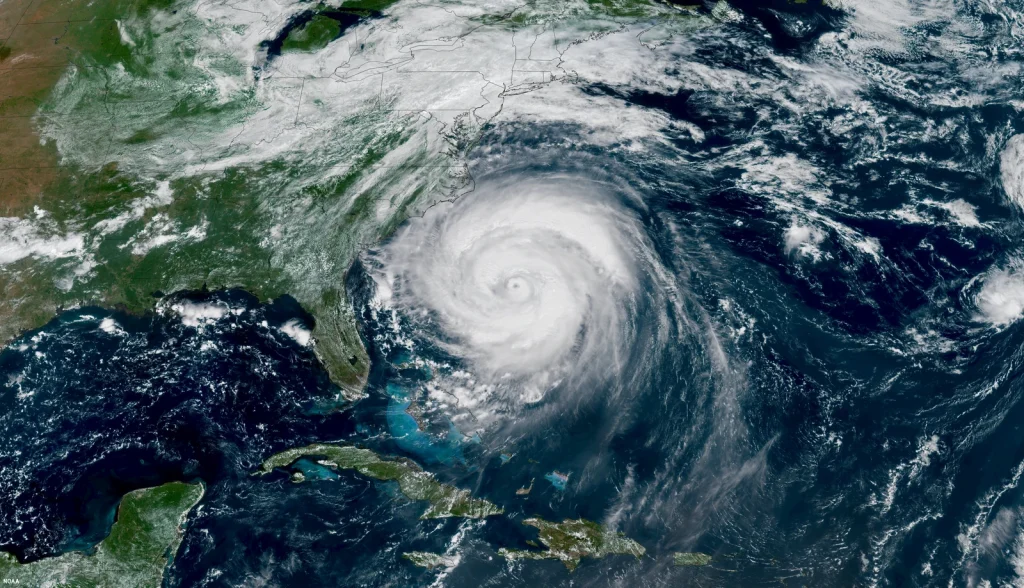
For Florida, the Carolinas, and the Gulf, this is real money. A single Category 2 landfall in a normal August would have cost the Southeast score five to eight points. Instead, the region held at 66.0, and city-level bookings in beach markets stayed on pace. The catch is that hurricane risk does not disappear; it defers. Peak activity historically runs from September 10 through October 15. Every operator in these regions should be running their storm playbook now, not the second forecasters put their market in a cone.
A regional reshuffle: Northeast takes the crown
The regional map was redrawn this month. The Northeast (68.0, +3.0) climbed past the Southeast for the first time all summer as fall foliage demand landed early. Cape Cod, Bar Harbor, Stowe, and the Hudson Valley all posted strong month-over-month gains on foliage search surges and Labor Day-plus-two-week booking windows. The Southeast (66.0, -10.0) pulled back sharply on normalization after a red-hot August, with beach markets stable but Miami and Myrtle Beach compressing as the calendar entered peak hurricane risk and gas hit $4.
| Region | Score | MoM Change | Condition |
| Northeast | 68.0 | +3.0 | Partly Sunny |
| Southeast | 66.0 | -10.0 | Partly Sunny |
| West | 60.0 | +2.0 | Partly Cloudy |
| Mountain | 58.0 | +1.0 | Partly Cloudy |
| Midwest | 48.0 | -2.0 | Cloudy |
The Northeast (68.0) now leads the country. Bar Harbor jumped to 84.0, the highest single-city reading in the index this month. Asheville surged 4.5 points to 82.5 as Blue Ridge foliage searches spiked three weeks earlier than the five-year baseline. Cape Cod slipped 1.5 as Labor Day mechanically closes the coastal window, but 82.0 is still a Sunny reading.
The Southeast (66.0) did not weaken so much as normalize. Miami dropped 18 points on peak hurricane nerves and $4-plus gas, the single largest one-city move in the index this month. Myrtle Beach softened four points on the post-Labor Day pull-forward. But Destin, Charleston, and Savannah all held Sunny ratings, and the quiet Atlantic is preserving supply that would normally be at risk.
The West (60.0), Mountain (58.0), and Midwest (48.0) all moved a point or two. Sedona, Denver, and Stowe each ticked up on early-fall demand. The Midwest crossed back into Cloudy on softer sentiment and higher gas exposure.
City movers
Asheville, NC (+4.5) led all risers on early Blue Ridge foliage demand. Stowe, VT (+4.0) followed with the strongest Vermont pace since 2023. Bar Harbor, ME (+1.5) rounded out the top three, cementing coastal Maine’s September position. The three fall-foliage markets accounted for the top three gains, a preview of what lies ahead over the next 60 days.
Miami, FL (-18.0) anchored the downside on hurricane-season entry and gas. Myrtle Beach, SC (-4.0) and Cape Cod, MA (-1.5) rounded out the bottom of the movers as beach demand shifted toward foliage. None of the three is weak in absolute terms, but each one gave back a piece of a very strong summer.
What this means for vacation rental property managers
62.0 Partly Cloudy in September means: the disconnect is your friend, not your enemy. Sentiment surveys are pushing back, but the guest with the credit card is booking. Your job is to remove hesitation for the people who are already leaning in. Five things to do in the next 30 days:
- Trust the booking curve, not the cable news
The 24-hour news cycle in August was ugly: confidence collapsing, tariff drama, gas at $4. The actual data cycle was the opposite: AirDNA RevPAR +7.2% in July, ADRs up in 49 of 50 markets, Labor Day airfare up only 2%, and HomeToGo search interest up 23%. If your team is pulling rates because CNN said the economy is soft, you are leaving money on the table. Look at your own seven-, 14-, and 30-day pace numbers, and let them drive your pricing rules.
- Lean into fall foliage early
Foliage searches spiked three weeks ahead of the five-year baseline. Asheville, Stowe, Bar Harbor, and the Hudson Valley are already running hot. If your portfolio touches any of these markets, the next four weeks are your peak pricing window. Push midweek rate on true peak dates, but keep Sunday-through-Thursday reasonable to catch the retiree and remote-worker segments driving early foliage demand.
- Winterize the September and early-October storm playbook
The season is quiet, not over. Peak activity is now compressed into a shorter window, which raises the odds that any single storm will matter. Documented flexibility windows, templated guest messages, and a pre-negotiated relocation backup plan are the difference between a Category 1 that costs you a weekend and a Category 1 that costs you three months of reviews. Use Hostfully’s guest communication tools to build the templates once and trigger them fast.
- Tell the total-trip-cost story honestly
Gas at $4.09 is not going away by Columbus Day. Rewrite drive-market copy to acknowledge and offset it: parking, kitchen, laundry, coffee, and pack-and-play included. Every included item is a hotel line item you are quietly killing. Guests already know the tank number. What they do not know is your full amenity list. Fix that.
- Extend length of stay with weekday value
The disconnect between sentiment and behavior tends to shorten booking windows and shorten stays. Fight the second one with weekday incentives. A three-night midweek deal packaged around remote work and a fall drive is easier to sell right now than a full week. Use Hostfully pricing rules to build stay-length triggers that fire automatically as your booking curve tightens.
Looking ahead: The October test
The October index will capture September data, including the meat of peak hurricane season and the first month of foliage. Four things we are watching:
Hurricane compression: An ACE of 3.6 through August is very low, but peak activity historically runs from September 10 through October 15. A quiet September pushes temperatures into the 80s. A Category 3 landfall could bring it down to under 50.
Sentiment stabilization: The August UMich drop was 6.3%, and the Conference Board is now at a seven-month low. Either September stabilizes, and the index reads it as a spike, or a second consecutive drop starts to look like a real trend.
Gas trajectory into fall: Refinery maintenance season and the switch to winter blend are normally price-friendly. Base case is $3.85 by Halloween. Bull case is $3.70. Bear case is $4.10 flat.
Foliage pace: If Asheville, Stowe, and Bar Harbor stay above 80 through October 15, the fall story is a full-season winner. If they normalize by Columbus Day, September was a pull-forward, not a trend.
Explore the full index
The Hosting & Travel Index updates monthly with fresh data across all seven components and 50-plus U.S. cities. Dig into regional breakdowns, track your market over time, and see what changed this month and why.
View the Hosting & Travel Index
About the Hosting & Travel Index
The Hostfully Hosting & Travel Index is a monthly composite score tracking the health of the U.S. vacation rental market. It aggregates seven weighted signals: TSA throughput (20%), Google Trends (20%), Hostfully platform data (15%), gas prices (15%), lodging CPI (10%), consumer sentiment (10%), and weather (10%). Data sources include TSA.gov, the U.S. Bureau of Labor Statistics, the University of Michigan, AAA, NOAA, Google Trends, AirROI, the U.S. Travel Association, and Hostfully’s proprietary booking data. The index covers 50+ U.S. metro areas with monthly city-level and regional scoring.
Sources: TSA.gov, AAA, University of Michigan Consumer Sentiment Survey, BLS CPI Data, Google Trends, NOAA National Hurricane Center, AirROI Market Data, U.S. Travel Association, Hostfully Platform Data.