
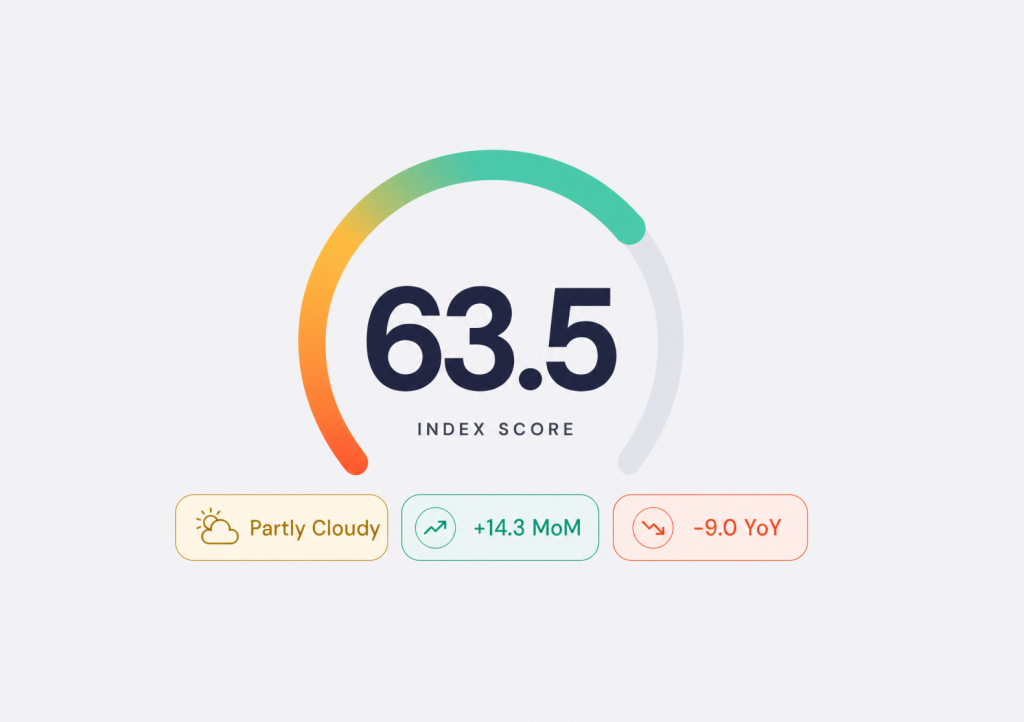
Every month, the Hostfully Hosting & Travel Index aggregates seven signals across the U.S. vacation rental landscape: TSA throughput, Google search trends, gas prices, lodging CPI, consumer sentiment, weather, and Hostfully platform data. Together they produce a single 0-to-100 Getaway Score that tells property managers whether the wind is at their back or in their face.
This month’s score: 63.5 out of 100, rated Partly Cloudy. That is 14.3 points above June and 9.0 points below July 2025. Five of seven components improved (sentiment, gas, TSA, trends, weather), one held steady (Hostfully platform), and one ran the other way (CPI). The June drumbeat of bad news flipped into the strongest setup of the year.
The big story: Five signals roared back at once
The single most useful number this month is sentiment. The University of Michigan’s final June Consumer Sentiment reading hit 49.5, a 10.5% jump off May’s record low and the second-largest monthly gain on record. 1-year inflation expectations cooled from 6.6% to 4.6%, and 5-to-10-year expectations dropped from 4.2% to 3.4%. The expectations sub-index regained 17%.
In plain English: consumers think prices are easing and they are loosening their grip on the wallet. The travel industry could not have asked for a better gift heading into the busiest weekend of the year. AAA expects 72.2 million Americans to travel for July 4 week, a new all-time record, with 85% driving. That is roughly 61 million road trips in nine days. Demand looks engaged in a way it has not all spring.
Gas: Below $4 for the first time since March
On May 21, the national average peaked at $4.56 per gallon. On June 29, it sits at $3.86, a 15% drop in six weeks. AAA confirms it is the first sub-$4 reading since late March. The trigger was the Iran ceasefire holding firm, which pulled the geopolitical premium out of Brent crude just as refiners eased into summer-grade fuel.
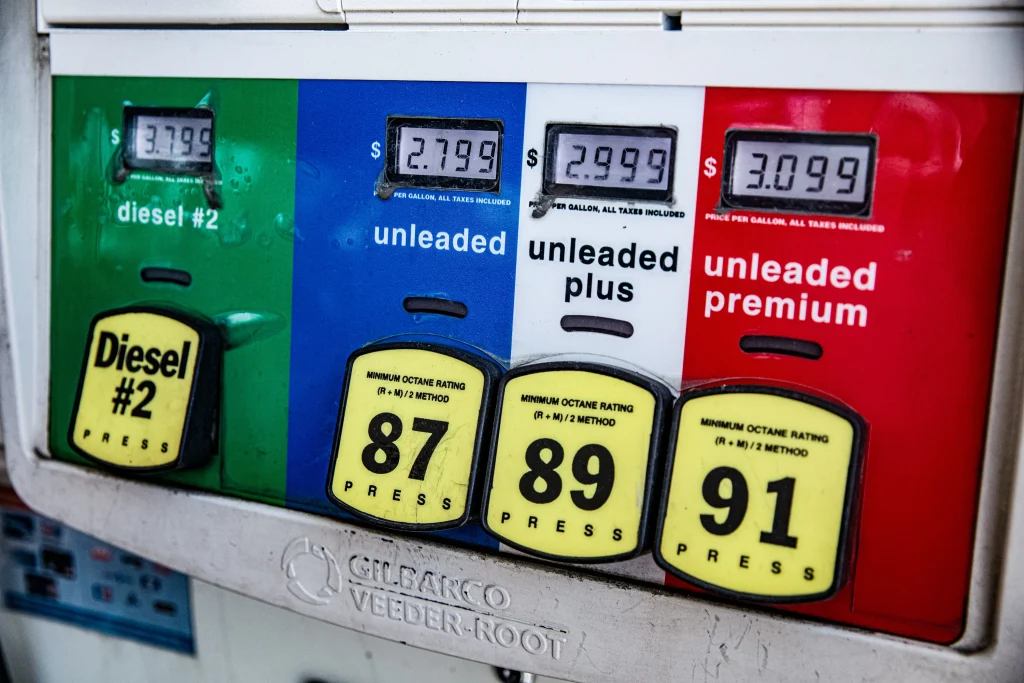
For a July 4 travel mix that is 85% road-trip, the timing is almost surgical. Every dime at the pump shifts buying power. If gas spent May acting as a tax on travel, June quietly handed it back. Drive markets within three hours of any major metro have a real summer in front of them.
Five up, one flat, one down: The component view
Here is the component-by-component view of why the score moved from 49.2 to 63.5:
| Signal | July | June | Change | Why |
| TSA Throughput | 78 | 72 | +6 | Record July 4 forecast (72.2M) |
| Search Trends | 78 | 70 | +8 | Beach, lake, parks queries surge |
| Gas Prices | 65 | 4 | +61 | $3.86/gal, below $4 first time since March |
| Lodging CPI | 35 | 60 | -25 | CPI 4.2% YoY, highest since 2023 |
| Sentiment | 28 | 2 | +26 | UMich 49.5, +10.5% MoM rebound |
| Weather | 70 | 50 | +20 | Hurricane ACE 81% below normal |
| Hostfully Data | 60 | 60 | Flat | TPI +9.8% YoY, demand flat |
The two signals doing the heaviest lifting are gas (+61) and sentiment (+26). Gas is a hard input; it directly changes what guests can afford. Sentiment is the soft input; it changes what guests are willing to spend even when affordability is unchanged. Both moved hard in the same direction at the same time, which is why the score posted its biggest gain on record.
“We just watched two of the heaviest weights come off in a single month. Gas eased, sentiment rebounded, and a record July 4 forecast lined up behind both. The hosts who built clean operations through the spring grind are about to be paid for it. Now is the moment to lean in, not coast.” Margot Schmorak, CEO, Hostfully
The one thing still running hot: CPI
The single component pointing the other way is lodging CPI. The Bureau of Labor Statistics May print came in at 4.2% YoY, the hottest reading since 2023. Energy ran +3.9% month over month, gasoline +7.0%, and the travel-specific lines were even louder: airfares +2.7% MoM and +26.7% year over year, hotels +5.1% YoY. Core CPI cooled to 0.2% MoM, so the headline is being driven by exactly the categories your guests notice on a trip.
Layer that on top of the U.S. Travel Association’s Travel Price Index running +9.8% YoY in May, its fourth straight accelerating month, and you have a guest who is more willing to book but more careful about the trip total. This is a pricing-discipline summer, not a pricing-aggression summer.
Industry data: Rate-driven growth continues
AirROI’s most recent U.S. short-term rental read shows RevPAR growth holding around 8% YoY, again rate-driven, with booked-night demand essentially flat. June Hostfully data points in the same direction: occupancy is steady, ADR is up, length of stay is shortening modestly. Operators with strong direct channels and tight gap-night recovery are out-earning operators relying on OTA defaults.
What that means practically: the bounce in macro signals does not mean the calendar fills itself. The work is still in the basics. Channel hygiene, dynamic minimum-night rules, and active guest messaging are doing more for July revenue than another rate hike.
Weather: Hurricane reprieve meets tornado reckoning
Tropical Storm Arthur formed in the Gulf on June 17 and clipped the Texas coast on June 17 and 18 before unwinding. Damage estimates landed in the $4 to $6 billion range. Cottonport, Louisiana set a state rainfall record at 29.06 inches. Galveston and coastal Houston took the hit; Houston (-3.5) and Galveston (-3.0) were the two biggest city decliners in the index.
Step back, though, and the season story is the opposite. According to the National Hurricane Center, Atlantic ACE is running 81% below normal year to date. Arthur was the only named storm of the early season. That is a major tailwind for Florida, Carolina, and Gulf operators heading into the heart of the calendar.

The other side of the ledger is tornadoes. June was the most active tornado month on record, with Illinois leading the country at 145-plus confirmed funnels, followed by major outbreaks on June 11, June 17, and June 21. Tornado activity does not drive seasonal demand the way hurricanes do, but it does demand a tight severe-weather playbook in the affected metros.
A regional tale of three Americas
Every region moved up this month, but the Southeast continues to operate in a different climate than everyone else. The spread between the Southeast (78.0) and the Midwest (48.0) is the widest we have seen since the index launched, and the Southeast just crossed into Partly Sunny territory for the first time this year.
| Region | Score | MoM Change | Condition |
| Southeast | 78.0 | +9.5 | Partly Sunny |
| West | 60.0 | +12.0 | Partly Cloudy |
| Northeast | 56.0 | +13.0 | Partly Cloudy |
| Mountain | 53.0 | +12.0 | Partly Cloudy |
| Midwest | 48.0 | +12.5 | Cloudy |
The Southeast (78.0) crossed into Partly Sunny. Hurricane ACE 81% below normal plus record-low gas plus drive-market demand created the strongest setup of the year. Destin (82.5), Myrtle Beach (82.0), Gulf Shores (81.5), Outer Banks (80.5), and Gatlinburg (80.0) are all rated Sunny.
The Northeast (56.0) and mountain (53.0) regions made the biggest leaps, both up 12 to 13 points. The Northeast caught the July 4 wave; the Mountain region opened its summer hiking and festival season. Lake Tahoe (+12.0) and Park City (+9.5) led the Mountain rebound.
The Midwest (48.0) remains the lowest-scoring region but improved 12.5 points. Detroit, Cleveland, and Minneapolis all gained 6-plus points yet stayed in the bottom five. If your portfolio is concentrated here, July is your operational catch-up window: the macro winds are finally helpful, and the comparison year is friendlier.
City movers
The top five sunniest cities are again all Southeast destinations, all rated Sunny for the first time this year: Destin (82.5, +4.1), Myrtle Beach (82.0, +4.5), Gulf Shores (81.5, +3.7), Outer Banks (80.5, +4.5), and Gatlinburg (80.0, +4.2). July 4 drive-market demand and the quiet hurricane season are the common threads.
Jackson, MS (+13.5) and Lake Tahoe (+12.0) led the upside movers, the former on tornado recovery and the latter on a strong summer mountain-season opening. Houston (-3.5) and Galveston (-3.0) anchored the downside, both Tropical Storm Arthur fallout. Phoenix (-2.5) and Las Vegas (-1.5) lost ground to seasonal heat fatigue, a recurring early-summer pattern.
What this means for property managers
A Partly Cloudy reading at 63.5 is the first genuinely friendly number we have seen in months, but it also raises the bar on execution. The opportunity is here. Five things to do in the next 30 days:
- Capture the drive market while gas is friendly
Sub-$4 gas plus 85% of July 4 travelers driving is your headline. Lead your July and August copy with explicit drive-time and tank-count language. “Three hours from Atlanta,” “Two tanks from Chicago,” “Half a tank from Charlotte.” Concrete distance still beats vague “easy escape” lines, and the math is in your favor right now.
- Price with discipline, not aggression
Airfares are up 26.7% YoY and hotels +5.1%. Your guests are noticing. The instinct to push rate into a record July 4 is real, but the discipline play wins the season. Use surge pricing for true peak nights, hold rate steady on shoulder nights, and resist the urge to chase pricing parity with hotels. Your value pitch is space, not nightly rate.
- Lean into the coastal story
Hurricane ACE running 81% below normal is the single most operator-friendly weather signal in two years. Florida, the Carolinas, and the Gulf can confidently market summer windows that felt risky last year. Add a quiet line to your listing about your flexibility policy and your local-knowledge support, and let the forecast do the rest of the work in guests’ minds.
- Tighten the severe-weather playbook
Quiet hurricane season does not mean quiet weather season. Tropical Storm Arthur and the record tornado month proved it. A templated guest message, a flexible cancellation policy, and a relocation backup plan are the difference between a one-star review and a five-star save. Build them once, deploy them every time, refine them quarterly.
- Add perceived value to outpace the pinch
Guests are willing to book again but they are checking the totals. Use Hostfully Digital Guidebooks to turn a basic check-in into a curated local experience. Bundle a welcome drink, a parking pass, or a partner discount into the listing without trimming the nightly rate. That is the right kind of upgrade in a Partly Cloudy month where every cost line is visible.
Looking ahead: August and mid-summer pacing
The August index will capture July data, including the actual July 4 results. Here is what we are watching:
July 4 actuals: AAA forecast 72.2 million travelers; TSA projected July 5 as a record screening day. Beat the forecast and August’s sentiment number gets another tailwind. Miss it and we relearn the gap between forecast and behavior.
Gas durability: The drop below $4 came fast. If hurricane season stays quiet and Brent stays around current levels, August could bring another leg down. A flare-up in the Strait of Hormuz reverses the calculus in a week.
Sentiment follow-through: One big rebound is news. Two in a row is a trend. We are watching the July preliminary UMich number for confirmation or fade.
Hurricane season: We are now in the heart of the Atlantic basin window. ACE at 81% below normal is the bullish case; the first major storm landfall would be the bearish one. Operators should re-test their messaging now, not when the cone is over their county.
Ride the bounce with Hostfully
A record July 4 means your inbox, channels, and guest messages are about to go vertical. Hostfully runs bookings, channels, guest communication, digital guidebooks, and homeowner reporting from one platform so you can actually enjoy summer too.
“The job in July is not to sit back and enjoy the bounce. It is to convert it. Guests came back faster than they left. The operators who treat the next 60 days as their real summer, not as a victory lap, are the ones who finish the year ahead.” Margot Schmorak, CEO, Hostfully
Explore the full index
The Hosting & Travel Index updates monthly with fresh data across all seven components and 50-plus U.S. cities. Dig into regional breakdowns, track your market over time, and see what changed this month and why.
View the Hosting & Travel Index
About the Hosting & Travel Index
The Hostfully Hosting & Travel Index is a monthly composite score tracking the health of the U.S. vacation rental market. It aggregates seven weighted signals: TSA throughput (20%), Google Trends (20%), Hostfully platform data (15%), gas prices (15%), lodging CPI (10%), consumer sentiment (10%), and weather (10%). Data sources include TSA.gov, the U.S. Bureau of Labor Statistics, the University of Michigan, AAA, NOAA, Google Trends, AirROI, the U.S. Travel Association, and Hostfully’s proprietary booking data. The index covers 50+ U.S. metro areas with monthly city-level and regional scoring.
Sources: TSA.gov, AAA, University of Michigan Consumer Sentiment Survey, BLS CPI Data, Google Trends, NOAA National Hurricane Center, AirROI Market Data, U.S. Travel Association, Hostfully Platform Data.