
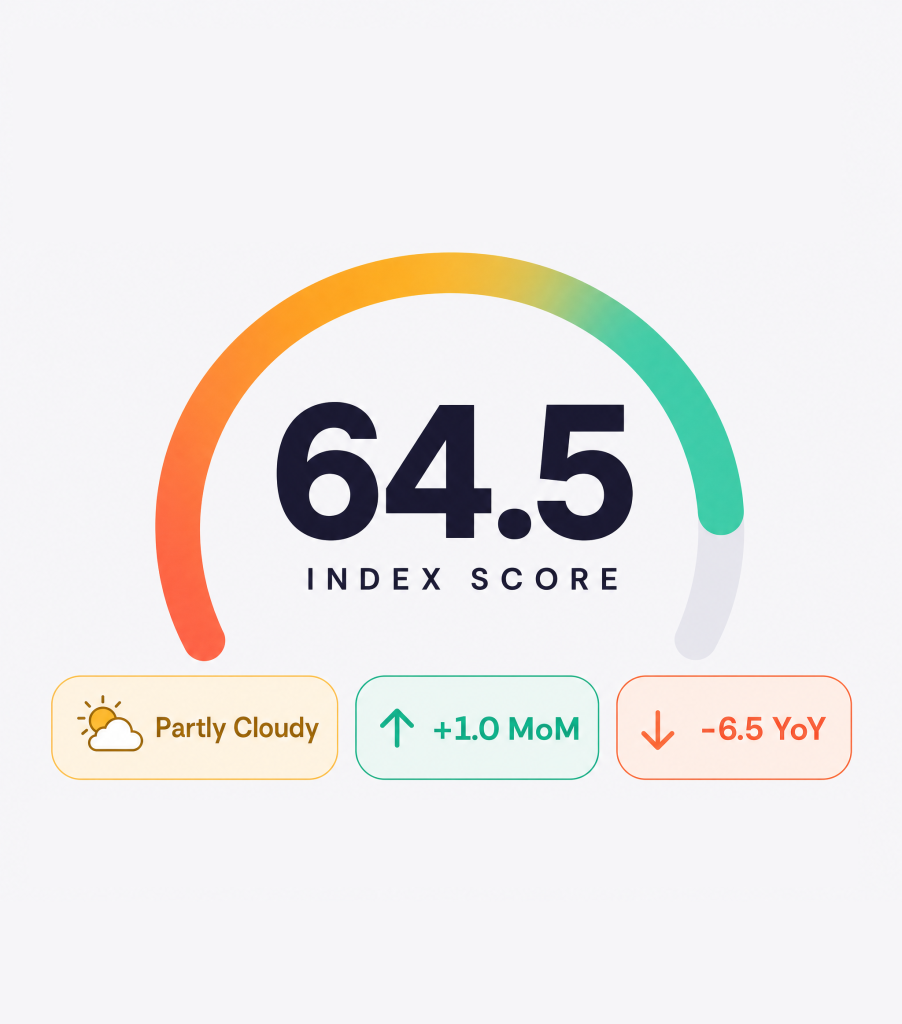
Every month, the Hostfully Hosting & Travel Index aggregates seven signals across the U.S. vacation rental landscape: TSA throughput, Google search trends, gas prices, lodging CPI, consumer sentiment, weather, and Hostfully platform data. Together they produce a single 0-to-100 Getaway Score that tells property managers whether the wind is at their back or in their face.
This month’s score: 64.5 out of 100, rated Partly Cloudy. That is 1.0 point above July and 6.5 points below August 2025. Four of seven components improved (sentiment, CPI, TSA, Hostfully), and three ran the other way (gas, trends, weather). July’s roaring rebound gives way to a much more mixed picture as the calendar turns to peak hurricane season and the gas story reverses on a Middle East flare-up.
The big story: Two wins, two new headwinds
July delivered the two big wins the index has been waiting for. First, sentiment held its rebound: the University of Michigan’s July final Consumer Sentiment reading came in at 55.2, up 11.5% from June’s 49.5 and the highest reading in five months. It is still 10.5% below a year ago, but two consecutive strong monthly gains is what a trend looks like.
Second, CPI finally cracked. The June CPI release on July 14 came in at 3.5% YoY, down from 4.2% in May and posting a -0.4% month-over-month decline, the largest single-month drop since April 2020. Gasoline led it down at -9.7% MoM (although still +26.7% YoY), and core CPI cooled to 2.6% YoY from 2.9%. The prints landed in the window between when guests booked their July 4 trips and when they started booking August.
Then July did what July does. Gas prices bottomed at $3.79 on July 7, then reversed hard on renewed Iran tensions. AAA reported a 15-cent one-week jump to $4.09 on July 23. Most states are now averaging $4 or higher heading into peak August travel. The affordability tailwind that carried July 4 is gone by August 4.
And the calendar shifts. August through October is when roughly 90% of Atlantic hurricane activity happens. NOAA still forecasts a below-normal Atlantic season and ACE is running well below median, but seasonal risk climbs sharply this month. A single Category 2 landfall would reset the story for Florida, the Carolinas, and the Gulf overnight.
July 4 actuals: The forecast delivered
AAA’s pre-holiday call proved conservative. AAA counted a record 72.2 million Americans traveling June 27 through July 5, up 1.7% from 2025 and the strongest July 4 week on record. The mix: 61.4 million by car, 5.85 million by air, and 4.93 million by other modes. Road travel was the story again, and cheap gas at the start of the window did its job.

The TSA delivered its side of the deal too. TSA screened nearly 18.7 million air travelers over the July 4 window (June 30 through July 6), with July 2 peaking near 3 million screenings, the busiest single travel day of the year so far. Airports handled it without the meltdown headlines that have colored past July 4 windows. That matters for August pacing: guests who had a smooth summer trip are more likely to book another one.
Four up, three down: The component view
Here is the component-by-component view of why the score moved from 63.5 to 64.5:
| Signal | August | July | Change | Why |
| TSA Throughput | 82 | 78 | +4 | 18.7M July 4 window; 3M peak day |
| Search Trends | 74 | 78 | -4 | Post-July 4 seasonal cool-off |
| Gas Prices | 48 | 65 | -17 | $4.09 late July on Iran flare-up |
| Lodging CPI | 62 | 35 | +27 | CPI 3.5% YoY, largest MoM drop since 2020 |
| Sentiment | 58 | 28 | +30 | UMich 55.2, five-month high |
| Weather | 62 | 70 | -8 | Peak hurricane season begins; SW heat dome |
| Hostfully Data | 65 | 60 | +5 | July 4 booking surge; ADR firm |
The two signals doing the heaviest lifting are CPI (+27) and sentiment (+30). Those are the deep macro inputs, and both moved in a direction that helps summer bookings. The pushback is gas (-17) and weather (-8), which are the seasonal inputs that guests actually feel in the moment. Net: the score edged up, but the mix underneath it flipped from “everything working together” to “macro helping, seasonal fighting.”
“July delivered on the forecast. A record 72.2 million travelers, cheap gas at the pump, and sentiment back at a five-month high. August is the harder question. Gas is back above $4, hurricane season is here, and the guest is smarter about the total trip cost than they were in June. The operators who kept their spring discipline going through July are ready for it. The ones who assumed the tailwind would last are about to find out otherwise.” Margot Schmorak, CEO, Hostfully
Gas: The 24-cent whipsaw
The July gas story was two stories. In the first half of the month, the national average slid from $3.86 on June 29 to $3.79 on July 7, giving July 4 drivers the cheapest holiday pump prices in years. Then geopolitics reasserted itself. A renewed Iran tension flare-up pushed the average 15 cents higher in the week ending July 23, to $4.09. Most state averages are now $4 or above. That is a 24-cent swing in three weeks and a full reset of the drive-market calculus.
Practically, the guest who booked a July 4 road trip when gas was under $3.80 is looking at their August tank at $4.10. That is roughly $6 more per fill on a mid-size SUV. Not devastating, but visible. Drive markets within three hours of a major metro still win, but the “tank math” copy that worked in July needs an honest update in August.
CPI: The cooling guests actually feel
The June CPI release on July 14 was the friendliest inflation print in more than four years. BLS confirmed headline CPI at 3.5% YoY, down from 4.2% in May, with -0.4% month over month, the largest single-month decline since April 2020. The heavy lifting came from energy: gasoline dropped 9.7% MoM (though still +26.7% YoY off a low base), and food at home cooled to +1.9% YoY.
Core CPI cooled too, to 2.6% YoY from 2.9%. Shelter finally started behaving, and travel-specific lines moderated. That is the kind of print that reinforces the sentiment rebound rather than fighting it. For property managers, it removes some of the total-trip-cost anxiety that had been in the way in the spring.
Industry data: The booking curve held
AirROI’s latest U.S. short-term rental read continues to show rate-driven RevPAR growth with modest occupancy support. July Hostfully platform data confirms it: occupancy firmed through the July 4 window, ADR held, and length of stay came back a half day on the East Coast. Operators who tuned pricing rules in June and left them alone through July out-earned those who chased the rebound with rate hikes.
The August question is whether the booking curve shortens. Guest sentiment is up, but the gas whipsaw and hurricane calendar tend to compress booking windows. Watch the seven-to-fourteen-day pace closely. Portfolios with tight minimum-night logic and gap-night recovery will convert that shortened window better than portfolios waiting for a longer runway.
Weather: Peak hurricane season meets a Southwest heat dome
Two weather stories run in parallel through August. The first is the Atlantic. Peak hurricane season officially runs August through October, with roughly 90% of ACE landing in that window. NOAA still calls for a below-normal season overall, and year-to-date ACE remains well below median. That is a real edge for Florida, the Carolinas, and Gulf operators, but the seasonal risk climbs sharply this month regardless.

The second story is the Southwest. A late-July heat dome pushed Phoenix into consecutive 115-plus-degree days and drove Phoenix down 14.5 points month over month, the single biggest city decline in the index. Extreme heat is doing to Southwest August what hurricanes threaten to do to Southeast September. It is a demand-suppressing weather event, and it repeats every year.
A regional tale: The Northeast takes over
Two regions swapped narratives this month. The Southeast, which owned the July story, cooled 2 points to 76.0 as heat and hurricane-season entry took the shine off. The Northeast, which has been the laggard for a year, jumped 9 points to 65.0, its highest reading since launch and just over the threshold into Partly Sunny territory. Peak Northeast summer landed in force.
| Region | Score | MoM Change | Condition |
| Southeast | 76.0 | -2.0 | Partly Sunny |
| Northeast | 65.0 | +9.0 | Partly Sunny |
| West | 58.0 | -2.0 | Partly Cloudy |
| Mountain | 57.0 | +4.0 | Partly Cloudy |
| Midwest | 50.0 | +2.0 | Partly Cloudy |
The Northeast (65.0) made the biggest jump. Cape Cod, Bar Harbor, and the Hamptons all posted the strongest month over month gains in the country. This is what peak Northeast summer looks like on the index: a nine-point regional swing driven by three months of latent booking demand landing at once.
The Southeast (76.0) stayed on top but cooled 2 points. The story is not weakness, it is that the July setup was so strong that any move was likely to be a step back. Myrtle Beach, Destin, and the Outer Banks all stayed in Sunny territory. The August risk is a hurricane event, not a demand event.
The West (58.0) slipped 2 points on the Phoenix heat wave and the Miami slowdown (Miami is regional West in our index composite). Mountain (57.0) added 4 points on peak summer hiking and festival season. Midwest (50.0) crossed into Partly Cloudy for the first time this year, up 2 points from a mild-weather assist.
City movers
The top sunniest cities flipped from Southeast dominance to a Northeast top two: Cape Cod, MA (83.5, +6.0) and Bar Harbor, ME (82.5, +5.0) took the top spots. Myrtle Beach (82.0), Destin (81.5), and Outer Banks (81.0) held their Sunny ratings but did not extend. The story is a Northeast surge, not a Southeast fade.
Phoenix (-14.5) anchored the downside, its worst month since the index launched. Miami (-4.5) and Houston (-3.5) rounded out the bottom of the movers on early hurricane-season nerves and lingering heat. The Hamptons, NY (+4.5) joined Cape Cod and Bar Harbor as the third-strongest Northeast riser, a reminder that August is when the Hamptons finally clears June coastal fog and June rate resistance.
What this means for property managers
64.5 Partly Cloudy is not a green-light month. It is a month where the good macro news is real but the seasonal risks are also real. Five things to do in the next 30 days:
- Refresh the drive-market copy for $4 gas
The July “tank math” copy assumed sub-$4 gas. August guests are looking at $4.10 or higher in most states. Rewrite drive-time and cost-per-trip copy honestly. “Three hours from Boston” still works. “$40 in gas each way” does not. Update the specifics or drop them entirely, and lean on non-cost benefits like flexibility, space, and local access.
- Winterize the August cancellation playbook now
Peak hurricane season is here. Even in a below-normal year, a single Category 2 landfall resets your booking calendar for two weeks. Templated guest messages, a documented flexibility window, and a relocation backup plan are the difference between a review-torching cancellation and a save. Build the playbook once, deploy it every time, refine it after each event.
- Lean into the Northeast window
The Northeast just posted its best month on the index. Cape Cod, Bar Harbor, the Hamptons, and coastal Maine are running hot. If your portfolio is here, this is the four-to-six-week window where pricing discipline pays. Push rate on true peak dates, hold rate steady on Sunday-through-Thursday, and use Hostfully Digital Guidebooks to upgrade the guest experience without a rate hike.
- Read the booking curve, not the headlines
The gas whipsaw and hurricane-season entry both compress booking windows. Your seven-to-fourteen-day pace is the tell. If it is holding, run your normal minimum-night and gap-night rules. If it is shortening, loosen minimum nights on gap dates and add same-week discount triggers before the calendar goes soft. The index tells you the weather; your booking curve tells you what to actually do this week.
- Use CPI relief to reinforce the value story
June CPI at 3.5% YoY, down from 4.2%, is the friendliest total-cost-of-trip signal in more than a year. That is a real gift for the value pitch. Update your listing language to reflect that trip totals are moving in guests’ favor, and pair it with concrete perks (parking, welcome basket, guidebook access) that hotels cannot match. This is the month to reinforce “space, not nightly rate” as your positioning.
Looking ahead: September and the real test
The September index will capture August data, including the first month of peak hurricane season and the tail of the summer booking curve. Four things we are watching:
Hurricane activity: ACE remains well below normal and NOAA still forecasts a below-normal season, but August is when the Atlantic wakes up. A quiet month sends the score up. A single major landfall could push weather back into the 30s.
Gas durability at $4-plus: The Iran-driven bounce could ease if tensions calm, or it could extend if the Strait of Hormuz stays in the headlines. Sub-$3.80 by Labor Day is the bullish case; sub-$4.30 flat is the base case.
Sentiment follow-through: Two consecutive strong UMich prints is a trend. Three would confirm the rebound. The August preliminary print is the next tell.
Northeast peak sustainability: Cape Cod at 83.5 and Bar Harbor at 82.5 are both toward the top of their normal August ranges. The question is whether they hold through Labor Day or start pulling back on early back-to-school pacing.
Navigate the crosswinds with Hostfully
Peak August, peak hurricane season, and a gas whipsaw all landing at once. Hostfully runs bookings, channels, guest communication, digital guidebooks, and homeowner reporting from one platform so you can react fast when the wind shifts, without missing a message or a payout.
“The July 4 win is banked. August is where operators earn their year. The crosswinds are real, and the guests feel every one of them. The playbook is unglamorous: rewrite the drive-market copy, tighten the storm plan, hold pricing discipline, and read the booking curve every day. Do those four things and the numbers will follow.” Margot Schmorak, CEO, Hostfully
Explore the full index
The Hosting & Travel Index updates monthly with fresh data across all seven components and 50-plus U.S. cities. Dig into regional breakdowns, track your market over time, and see what changed this month and why.
View the Hosting & Travel Index
About the Hosting & Travel Index
The Hostfully Hosting & Travel Index is a monthly composite score tracking the health of the U.S. vacation rental market. It aggregates seven weighted signals: TSA throughput (20%), Google Trends (20%), Hostfully platform data (15%), gas prices (15%), lodging CPI (10%), consumer sentiment (10%), and weather (10%). Data sources include TSA.gov, the U.S. Bureau of Labor Statistics, the University of Michigan, AAA, NOAA, Google Trends, AirROI, the U.S. Travel Association, and Hostfully’s proprietary booking data. The index covers 50+ U.S. metro areas with monthly city-level and regional scoring.
Sources: TSA.gov, AAA, University of Michigan Consumer Sentiment Survey, BLS CPI Data, Google Trends, NOAA National Hurricane Center, AirROI Market Data, U.S. Travel Association, Hostfully Platform Data.