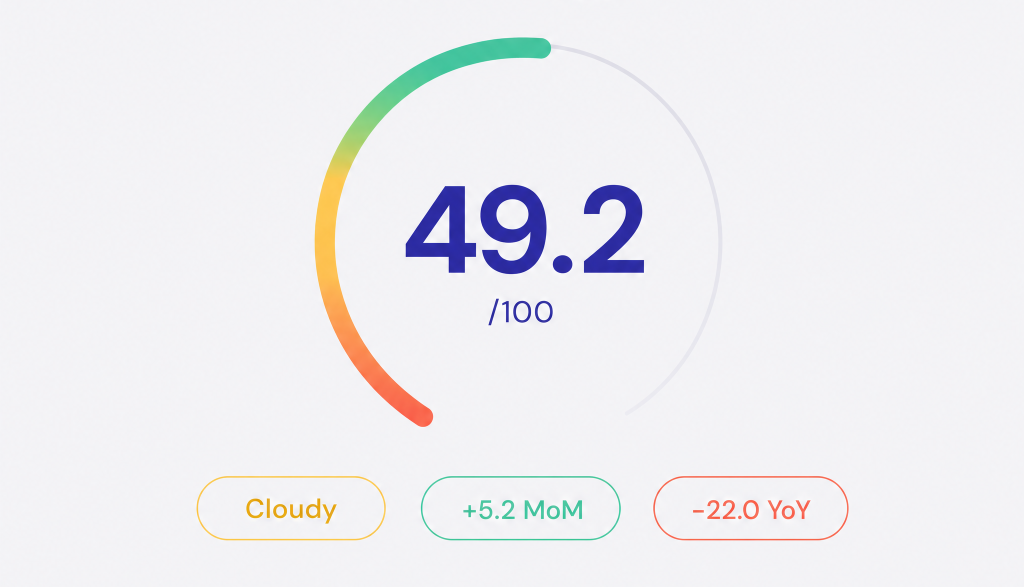
Every month, the Hostfully Hosting & Travel Index aggregates seven signals across the U.S. vacation rental landscape: TSA throughput, Google search trends, gas prices, lodging CPI, consumer sentiment, weather, and Hostfully platform data. Together they produce a single 0-to-100 Getaway Score that tells property managers whether the wind is at their back or in their face.
This month’s score: 49.2 out of 100, rated Cloudy. That is 5.2 points above May and 22.0 points below June 2025. Five of seven components improved, two slipped, and the one that slipped the most happens to be the one that scares us a little.
The big story: Sentiment just broke its own floor
The University of Michigan’s final May Consumer Sentiment Index landed at 44.8, a new all-time low and the third straight monthly decline. The previous floor of 49.8, set in April, lasted exactly one month. Long-run inflation expectations climbed to 3.9%, a seven-month high, with 57% of respondents spontaneously citing high prices as a top concern. The expectations sub-index slid to 44.1.
To put that in plain English: consumers think prices are about to get noticeably worse, and they are bracing for it. Yet the rest of the month told a different story. AAA forecast 45 million Americans traveling for Memorial Day, a record. Bookings did not blink. We have entered the phase where sentiment surveys and travel behavior are running on separate tracks, and operators need to plan for both.
Gas: Peaked, then pulled back
Mid-May gas prices touched $4.56 per gallon on the national average, the cycle high. Then an Iran ceasefire pulled Brent crude down nearly 20% from its peak, and the pump price followed. By May 30 the average sat at $4.36, still elevated but visibly easing. June arrives with the wind no longer blowing in our face.

AAA’s Memorial Day forecast pegged 87% of travelers as drivers. That is the kind of share where every ten cents at the pump matters to your booking calendar. The fact that the price has rolled over heading into June is the biggest positive shift in the index this month.
Five up, two down: The component view
Here is the component-by-component view of why the score moved from 44.0 to 49.2:
| Signal | June | May | Change | Why |
| TSA Throughput | 72 | 78 | -6 | Easing after spring peak |
| Search Trends | 70 | 60 | +10 | Summer search wave starting |
| Gas Prices | 4 | 5 | -1 | $4.36/gal, peak passed |
| Lodging CPI | 60 | 70 | -10 | Energy +3.8% MoM, lodging +2.4% |
| Sentiment | 2 | 4 | -2 | UMich 44.8, new record low |
| Weather | 50 | 45 | +5 | NOAA below-normal hurricane forecast |
| Hostfully Data | 60 | 65 | -5 | RevPAR +8% YoY but rate-driven |
The two improvements doing the heavy lifting are search trends and weather. Google Trends for vacation-rental terms jumped as Memorial Day kicked off the summer search wave. And NOAA’s Climate Prediction Center called for a below-normal Atlantic hurricane season with a 55% probability of below-normal activity, 8 to 14 named storms, and 3 to 6 hurricanes. That is a significant tailwind for Florida, the Carolinas, and Gulf operators planning their summer.
“The headline number bounced, but sentiment broke another floor. We are in the part of the cycle where the operators with strong systems, sharp pricing, and active guest communication keep winning, and everyone else gets caught flat-footed. Demand is still here. It is just running hotter and choosier than it did a year ago.” Margot Schmorak, CEO, Hostfully
Industry data: Growth mode to optimization mode
AirROI’s latest read on the U.S. short-term rental market shows RevPAR up roughly 8% year over year, which on its face is a healthy print. Dig in and the picture sharpens: gains are rate-driven, with ADR doing most of the work while booked-night demand has flattened. The market is maturing from growth mode to optimization mode.
What that means in practice: filling the calendar matters more than chasing the next rate hike. Length-of-stay flexibility, smart minimum-night settings, and disciplined gap-night recovery are the levers that move revenue now. The hosts pushing rate hardest into a flat-demand backdrop are the ones most exposed to occupancy slippage.
Weather: A loud month, then a quiet forecast
May 2026 brought 278-plus preliminary tornadoes, including a multi-day outbreak across Mississippi on May 6 and 7 that produced eight confirmed twisters, and a violent EF3 in Beggs, Oklahoma. Jackson, Mississippi posted the worst single-month drop in our city index at -6.8.

That is the loud part. The quieter part is the forward outlook. NOAA’s below-normal hurricane forecast is the most operator-friendly weather signal in nearly two years. Florida and Carolina coastal markets responded immediately: Destin (+3.2), Gulf Shores (+5.2), Charleston (+4.5), and the Outer Banks (+3.9) all popped in the city rankings.
A regional tale of three Americas
Every region moved up this month, but the gap between the Southeast and the rest of the country widened again. The Southeast is now operating in a different climate than the Midwest, and the spread is the widest we have seen since the index launched.
| Region | Score | MoM Change | Condition |
| Southeast | 68.5 | +1.7 | Partly Sunny |
| West | 48.0 | +1.8 | Cloudy |
| Northeast | 43.0 | +1.5 | Cloudy |
| Mountain | 41.0 | +2.8 | Cloudy |
| Midwest | 35.5 | +2.7 | Cloudy |
The Southeast (68.5) extended its lead. Coastal Florida, Alabama, and the Carolinas all caught the hurricane-forecast tailwind on top of the natural Memorial Day pull. Naples, Florida (+5.5) and Gulf Shores, Alabama (+5.2) were the two biggest city movers in the country.
The Mountain region (41.0) and Midwest (35.5) improved but remain stuck in the lower half of the table. The post-ski lull continues to drag on Park City and Lake Tahoe. The Midwest is still digesting tornado damage. If your portfolio is concentrated in those geographies, the next 60 days will reward sharper minimum-night rules and proactive guest outreach over rate moves.
City movers
The top five sunniest cities are again all Southeast destinations: Destin (78.4, +3.2), Gulf Shores (77.8, +5.2), Myrtle Beach (77.5, +1.0), Outer Banks (76.0, +3.9), and Gatlinburg (75.8, +2.3). Memorial Day search traffic and the hurricane outlook are the common threads.
Jackson, MS (-6.8), Tulsa, OK (-5.5), St. Louis (-4.2), Park City (-3.5), and Lake Tahoe (-3.0) anchored the bottom of the movers list. The first three were tornado-and-storm driven. The last two were seasonality. None signal demand weakness in vacation rentals overall.
What this means for property managers
A Cloudy reading at 49.2 means the worst of the spring drag has rolled off, but the summer setup still demands sharp execution. Five things to do in the next 30 days:
- Sell the drive market aggressively
Memorial Day proved Americans will drive. Gas is still elevated, but the trajectory is helpful. Lead your June and July copy with drive-time language: “Three hours from downtown Atlanta,” “Two tanks from the Mid-Atlantic.” Concrete distances beat vague “easy escape” lines every time when wallets are tight.
- Lean hard into the coastal story
NOAA’s below-normal hurricane forecast is a gift to Florida, the Carolinas, and the Gulf. Add a quiet line to your listing copy noting your flexibility policy and your local-knowledge support, and let the forecast do the rest of the work in guests’ minds.
- Stop pushing rate. Start pushing occupancy.
Industry RevPAR growth is real, but it is rate-driven on flat demand. Recheck your minimum-night settings, your gap-night discounts, and your length-of-stay rules. A 5% occupancy lift will beat a 5% rate hike in this environment, with less guest-facing friction.
- Add perceived value, not discounts
With sentiment hitting another record low, guests are scanning for value rather than the lowest sticker price. Hostfully’s Digital Guidebooks turn a basic check-in into a curated local experience without trimming your nightly rate. That is the right kind of upgrade in a Cloudy month.
- Pre-build your severe-weather playbook
Below-normal hurricane forecasts do not mean zero hurricanes. May’s tornado outbreak made the case. A flexible cancellation policy, a templated guest message, and a relocation backup plan are the difference between a one-star review and a five-star save. Build it before you need it.
Looking ahead: July and the summer peak
The July index will capture June data. Here is what we are watching:
Sentiment: Three straight monthly declines is a trend, not noise. Does June’s UMich preliminary catch a bid on easing gas, or do we set another all-time low?
Gas prices: The Iran ceasefire pulled crude back hard. If it holds, June pump prices fall further and the index gets another boost. If it breaks, the move reverses fast.
Summer pacing: July 4 forward bookings tell us how deep the demand pool actually runs. Watch the booking window, not the headline number.
Hurricane season: Atlantic season is now open. NOAA’s below-normal call is the bullish case. The first named storm and its track will tell us how much of that forecast is already priced in.
“The job in June is not to celebrate the bounce. It is to make sure your operations are tight enough to capture every guest who is still choosing to travel despite how they feel about the economy. That is where the real margin lives this summer.” Margot Schmorak, CEO, Hostfully
Explore the full index
The Hosting & Travel Index updates monthly with fresh data across all seven components and 50-plus U.S. cities. Dig into regional breakdowns, track your market over time, and see what changed this month and why.
View the Hosting & Travel Index
About the Hosting & Travel Index
The Hostfully Hosting & Travel Index is a monthly composite score tracking the health of the U.S. vacation rental market. It aggregates seven weighted signals: TSA throughput (20%), Google Trends (20%), Hostfully platform data (15%), gas prices (15%), lodging CPI (10%), consumer sentiment (10%), and weather (10%). Data sources include TSA.gov, the U.S. Bureau of Labor Statistics, the University of Michigan, AAA, NOAA, Google Trends, AirROI, and Hostfully’s proprietary booking data. The index covers 50+ U.S. metro areas with monthly city-level and regional scoring.
Sources: TSA.gov, AAA, University of Michigan Consumer Sentiment Survey, BLS CPI Data, Google Trends, NOAA Climate Prediction Center, AirROI Market Data, Hostfully Platform Data, CNBC.